Web-Based Access & Accessibility
Access real-time visualizations from anywhere with our cloud-native, browser-based platform. No software installation required.
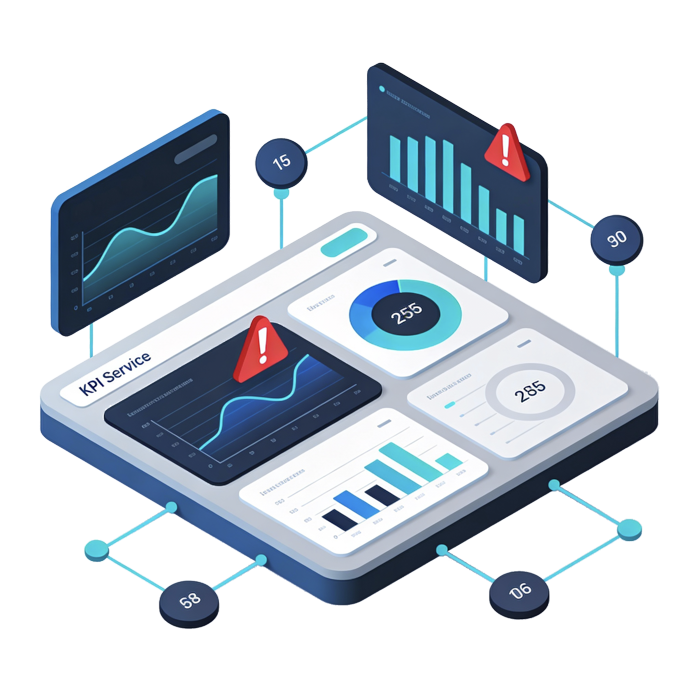
Transform complex subsurface data into intuitive, actionable insights with our powerful visualization platform
Access real-time visualizations from anywhere with our cloud-native, browser-based platform. No software installation required.
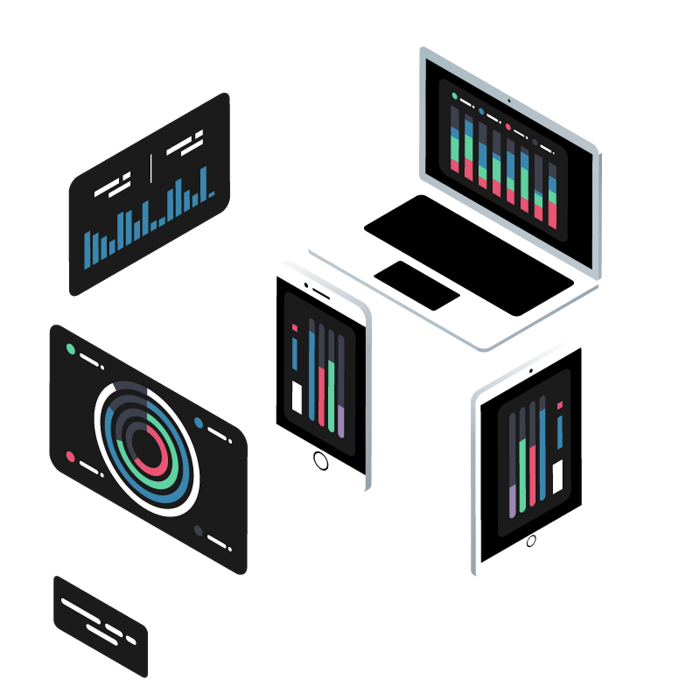
Access your data visualizations from any device, anywhere in the world with secure cloud infrastructure
Seamless experience across desktop, tablet, and mobile devices with responsive design
Launch directly in your browser—no plugins, no downloads, no compatibility issues
We build on proven, high-performance visualization technologies to accelerate delivery and ensure reliability in demanding energy workflows using visual interfaces drilling engineers already know and trust.
Render millions of data points in real-time with optimized WebGL and canvas rendering
Handle large datasets without performance degradation, from thousands to billions of data points
99.9% uptime SLA with redundant infrastructure and disaster recovery capabilities
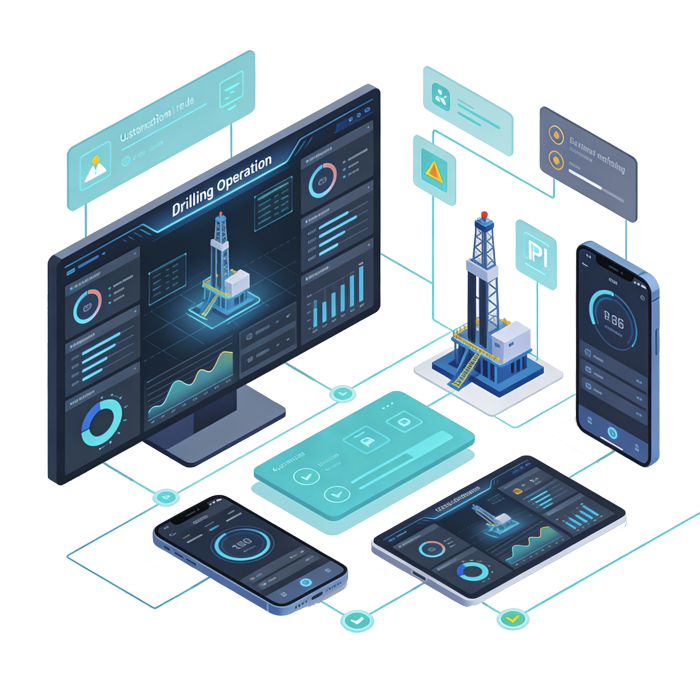
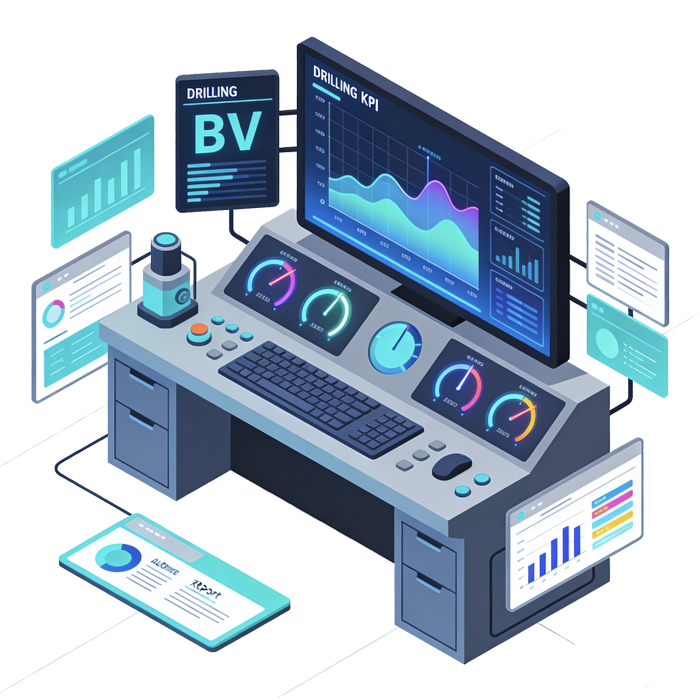
Visualize both live streaming data and historical trends on interactive, synchronized charts.
Monitor real-time data feeds with sub-second latency updates and automatic scaling
Analyze patterns over time with advanced zooming, panning, and timeframe selection tools
Linked charts maintain synchronized scaling and positioning for cross-variable analysis
Smart data caching optimizes performance while ensuring data freshness and accuracy
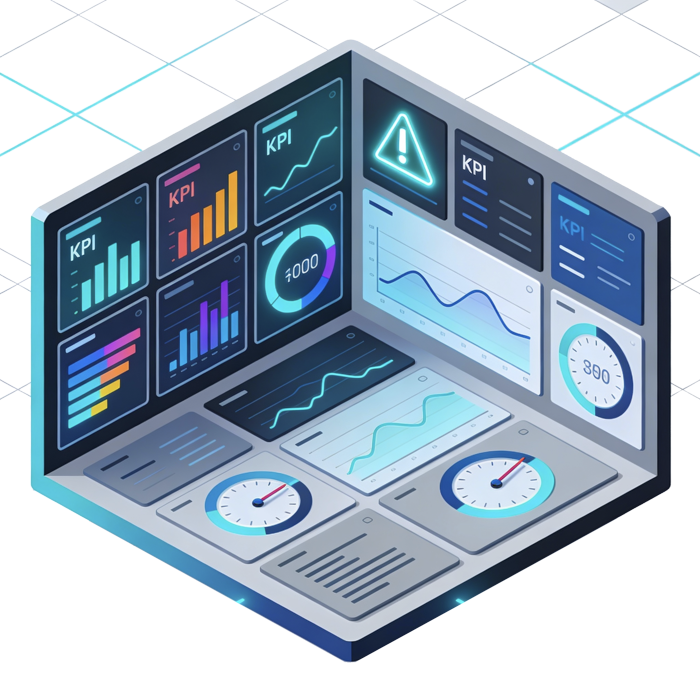
Create personalized visualization layouts tailored to your specific workflows and KPIs.
Design custom layouts by dragging visualization components without any coding required
Start with industry-specific templates or build from scratch with a component library
Configure different dashboard layouts and access levels for different user roles
Save unlimited dashboard configurations with auto-load for quick access to favorite views
Collaborate in real-time with team members while maintaining optimal performance at scale.
Share dashboards and annotations with team members with live synchronized updates
Monitor query performance, data latency, and visualization rendering metrics in real-time
Complete audit logs track all user actions and data access for compliance requirements
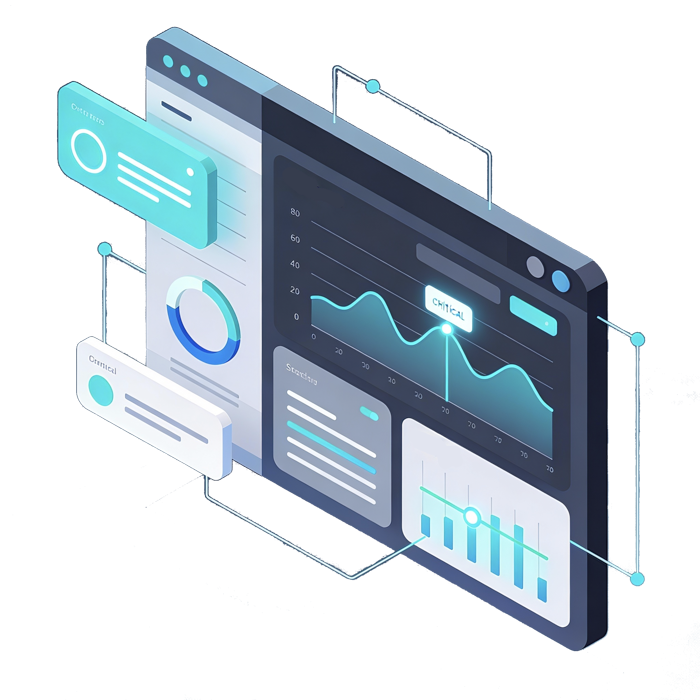
Powerful analysis capabilities including statistical functions, trend analysis, and predictive modeling.
Built-in statistical functions for mean, median, standard deviation, correlation, and regression analysis
Automatic anomaly detection and trend identification with customizable sensitivity thresholds
Leverage machine learning for forecasting and pattern prediction on historical data
Handle massive datasets with distributed computing and intelligent data sampling
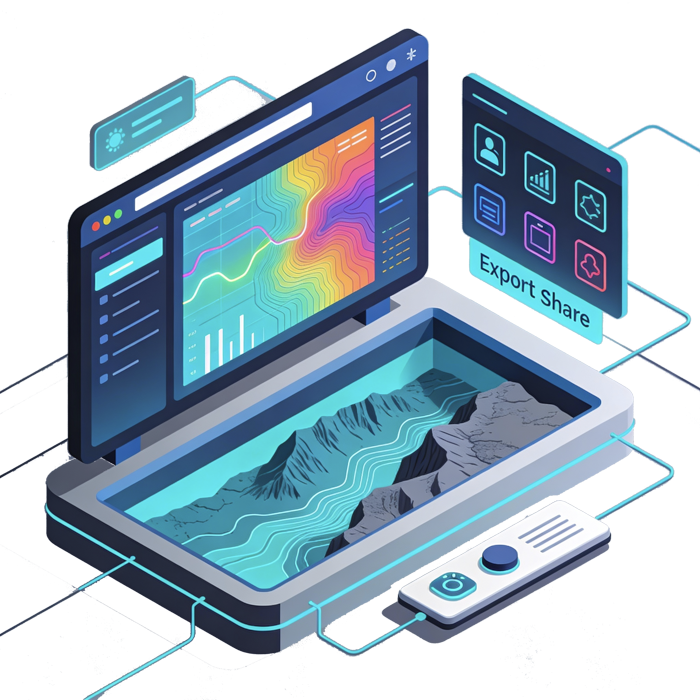
Zoom, pan, filter, and drill-down through your data with millisecond-fast interactions
Fully themeable visualizations with custom color palettes and branding options
Export visualizations as PNG, SVG, or PDF; share via links with permission controls
Discover how Advanced Visualization can unlock insights hidden in your subsurface data.